June 7, 2021
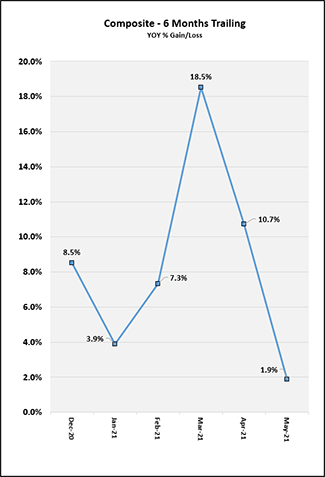
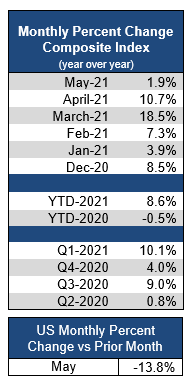
U.S. life insurance application activity slowed in May with Year-over-Year (YOY) activity up +1.9%, according to the MIB Life Index. The YOY comparison was impacted, in part, by a drop in May 2020 activity due to COVID-19. When comparing results to prior years, May 2021 activity is off from May 2019 by -2.5% and from May 2018 by -3.9%. Further, on a month-over-month (MOM) basis, May 2021 declined over April by -13.8%, representing the second consecutive MOM decline greater than 13%. While May has historically experienced MOM declines compared to April, the drop in 2021 was greater than most years. However, despite slowed growth, Year-to-Date (YTD) activity in 2021 continues to be the strongest on record with May 2021 up +8.6% over May 2020.


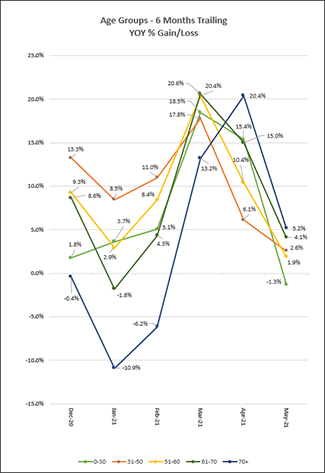
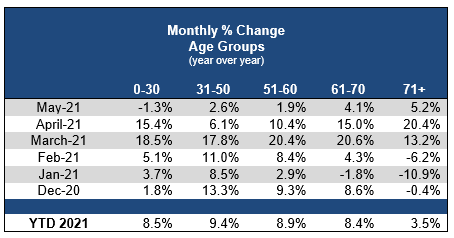
YTD, all age bands are at growth. On a YOY basis, ages 0-30 experienced a slight decline in activity of -1.3% in May, while all other age groups experienced growth. Ages 31-50 grew by +2.6%, ages 51-60 by +1.9%, ages 61-70 by +4.1% and ages 71+ grew by +5.2% YOY. Age 71+ saw the highest YOY gain across age bands for the second consecutive month, reversing a 12 month trend where this age group previously had the lowest YOY activity (April 2020 – March 2021).
YOY May activity was flat for face amounts up to $250K and at growth for all other categories. As face amounts increased, YOY growth percentages also increased with double-digit growth for face amounts over $500K including over +65% growth for face amounts over $5M. When examining age bands, growth was seen across all age groups and face amounts with the exception of ages 0-30 which saw a slight decline of -2.7% for face amounts up to and including $250K. Double-digit growth was seen YOY for ages 0‑30 for face amounts over $1M, ages 31-70 for face amounts over $500K and ages 71+ for face amounts over $250K. Notably, triple-digit growth was seen for ages 61-70 for face amounts over $5M and for ages 71+ for face amounts over $2.5M up to and including $5M.
Term Life saw a decline in May YOY of -4.7% while Universal Life and Whole Life saw increases of 9.5% and 5.2% respectively. Declines in Term Life and increases in Whole Life and Universal Life YOY were seen across all age bands, with increases in Universal Life in the double digits for those ages 31+.
Methodology Change for 2021: MIB has changed the way we report trends in application activity. Effective with our January report, variations with industry activity reflect a straight period over period percent changes (YTD, YOY, MOM, and QOQ) based on calendar days vs. the prior methodology based on a 2011 baseline index on a business day calculation.


Contact: Betty-Jean Lane, MIB Group, Inc., 781-980-0017, BLane@mib.com