December 7, 2021
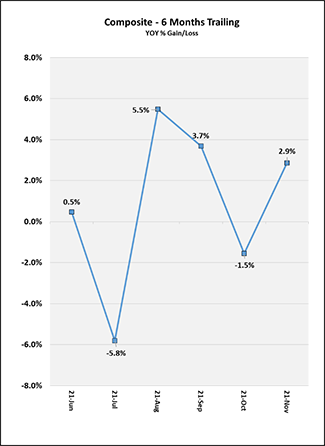
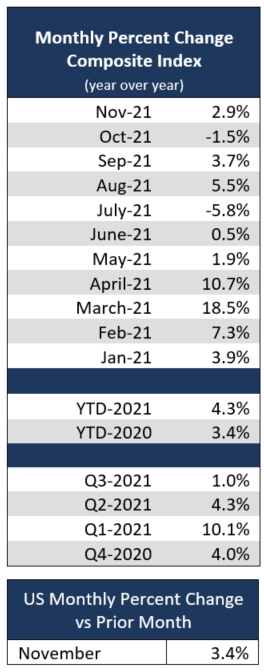
U.S. life insurance application activity was at growth in November 2021 compared to November 2020 with Year-over-Year (YOY) activity up at +2.9%. While YOY comparisons are impacted by fluctuations in 2020 activity due to COVID, when comparing November 2021 results to 2019, activity remains at growth at +4.2%. On a Year-to-Date (YTD) basis, the industry remained at growth with November 2021 up +4.3% over November 2020 and up +7.9% over 2019.


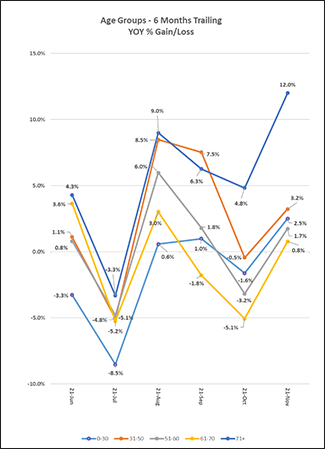
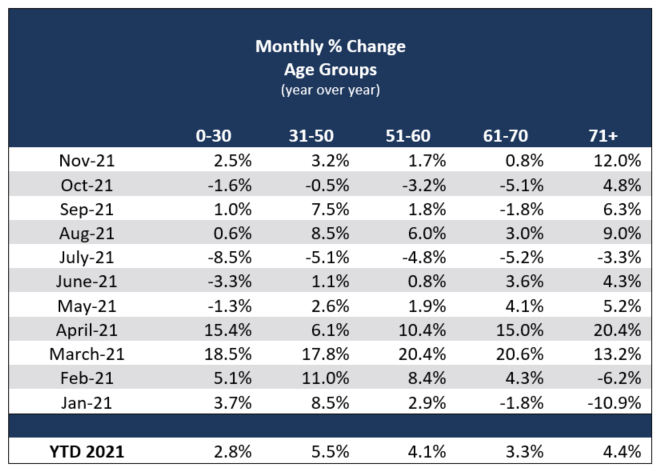
Activity for all ages returned to growth YOY or flat activity. Activity for ages 0-30 was up +2.5%, ages 31-50 up +3.2%, ages 51-60 up +1.7%, ages 61-70 up +0.8% and for ages 71+ up by +12.0%.
Age band patterns have been an interesting trend to watch due to fluctuations during 2020 driven by the COVID-19 pandemic, which affect the YOY comparisons. When comparing age band activity in November 2021 to pre-pandemic levels in November 2019, we see growth across ages 0-60 while ages 61+ show flat or declining activity.
Activity YOY for face amounts over $250K up to and including $500K was relatively flat, while all other amounts showed growth, in the double digits for amounts over $2.5M. When examining age bands, YOY activity for ages 0-30 showed growth for all face amounts with double-digit growth for amounts over $1M. Worthy of noting, YOY activity for age 0-30 grew by more than 50% for face amounts over $5M. Ages 31-50 saw YOY growth for amounts up to and including $250K and over $500K, in the double digits for amounts over $1M while amounts over $250K up to and including $500K showed flat activity. Ages 51-60 showed YOY growth for all amounts, in the double digits for amounts over $2.5M. Age 61-70 saw YOY declines for face amounts over $250K up to and including $500K and amounts over $1M up to and including $2.5M while all other amounts showed growth, in the double digits for amounts above $2.5M and significant double digits (>75%) for amounts over $5M (>75%). Ages 71+ saw YOY declining activity for amounts over $500K up to and including $1M, flat activity for amounts over $1M up to and including $2.5M and growth for all other amounts, in the double digits for amounts up to $250K and significant double digits (>95%) for amounts over $2.5M.
November 2021 saw growth in Whole Life and Term application activity YOY of +13.0% and +2.1% respectfully while Universal Life declined by -11.2%. Activity for Term Life showed growth for ages 31-50, declined by double digits for ages 61+ and was flat for all other age groups. Whole Life saw growth across all age bands, in the double digits for ages 0-50 and 71+. Universal Life saw declining activity for ages 0-70, in the double digits for ages 31-50 and growth for ages 71+.
Methodology Change for 2021:
MIB has changed the way we report trends in application activity. Effective with our January report, variations with industry activity reflect a straight period over period percent changes (YTD, YOY, MOM, and QOQ) based on calendar days vs. the prior methodology based on a 2011 baseline index on a business day calculation.

